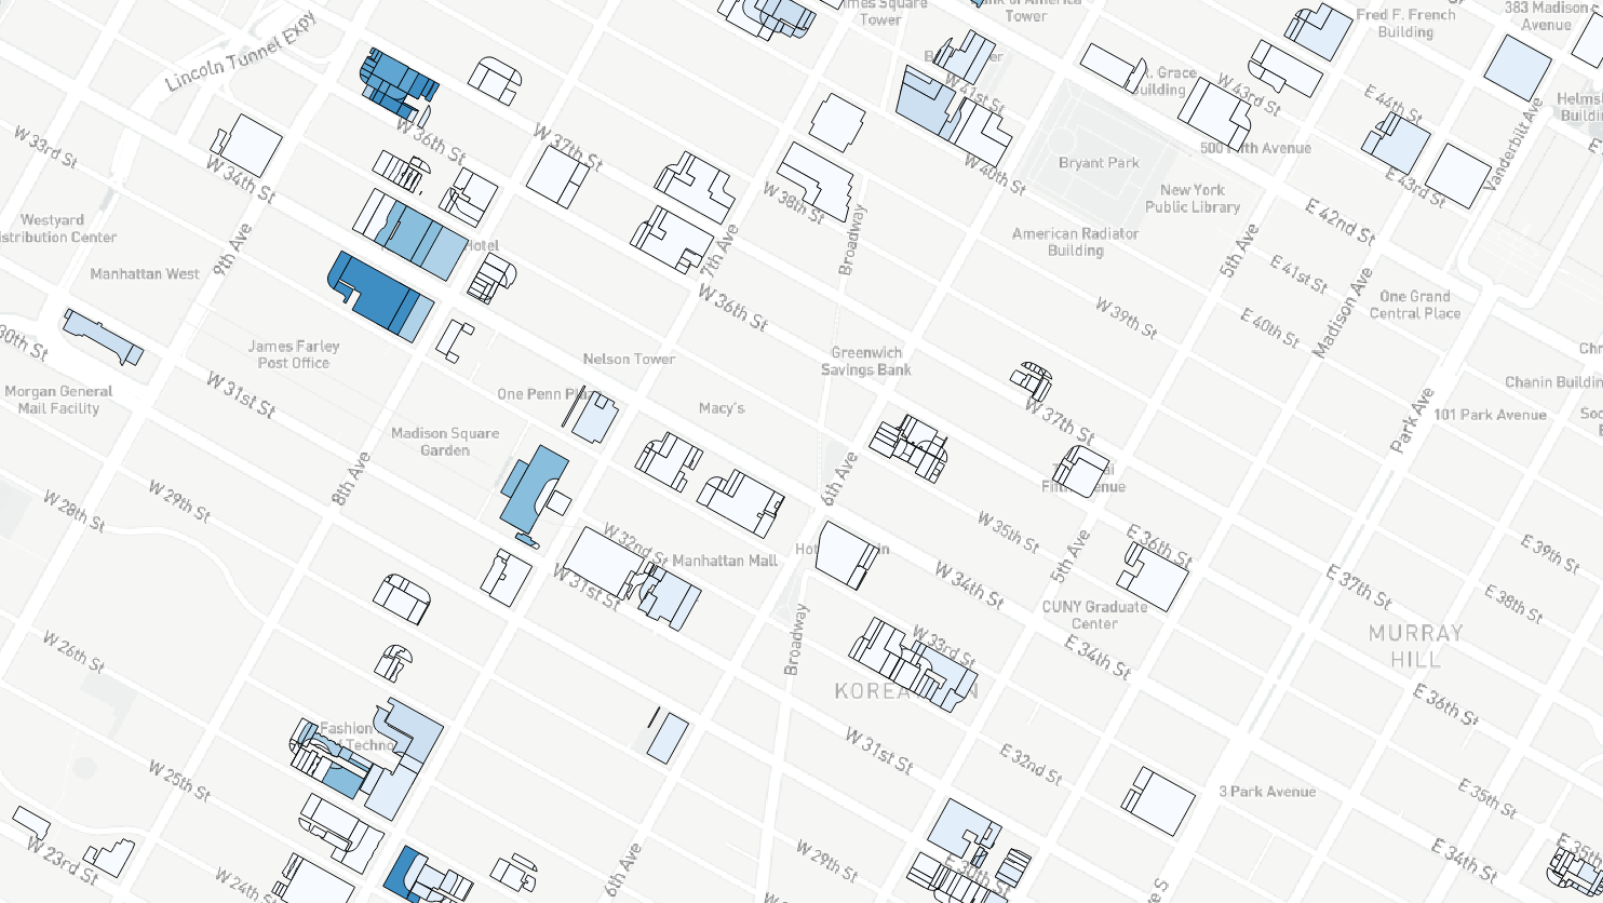
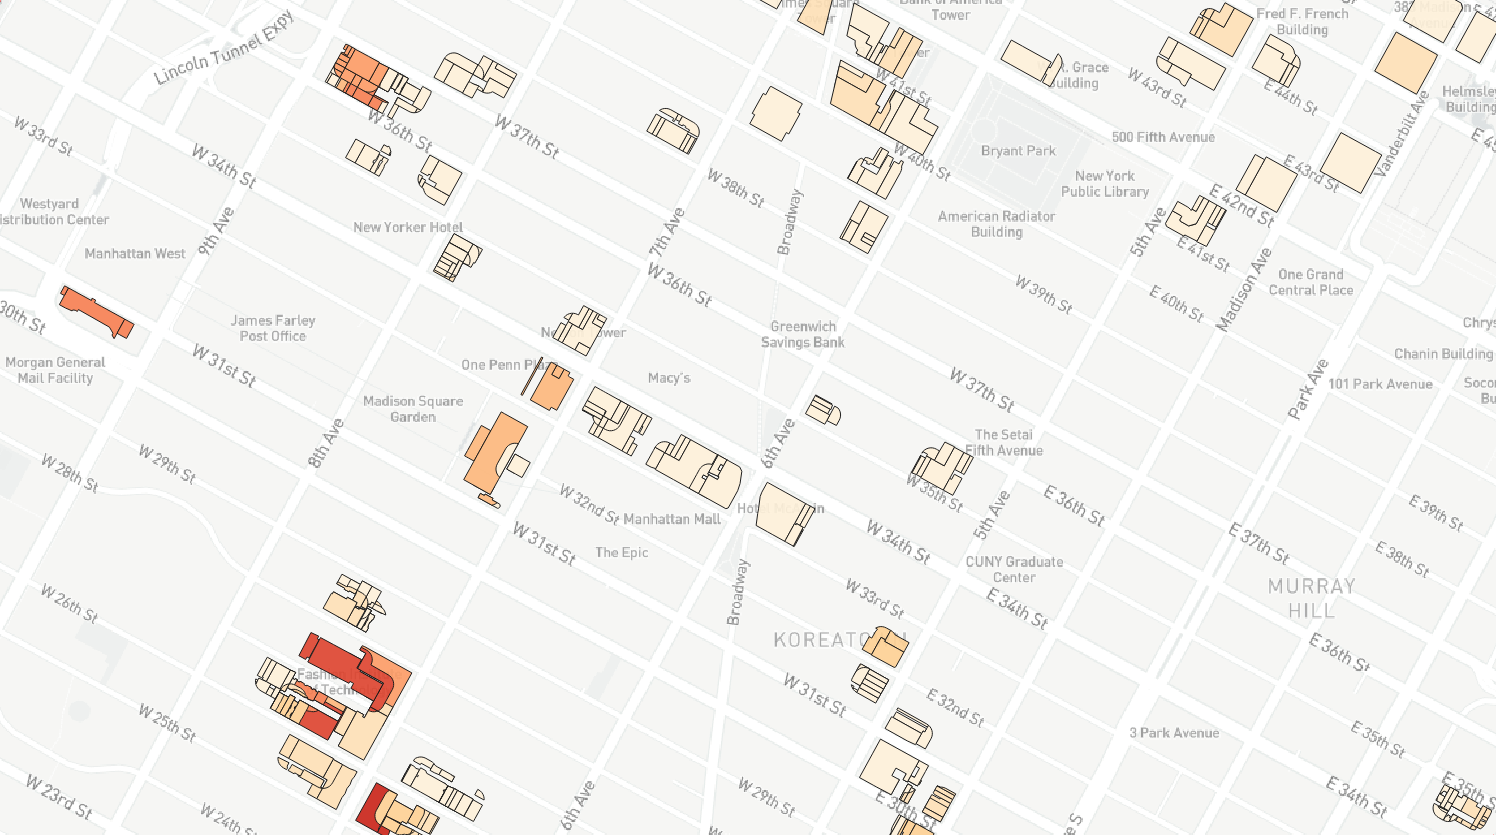
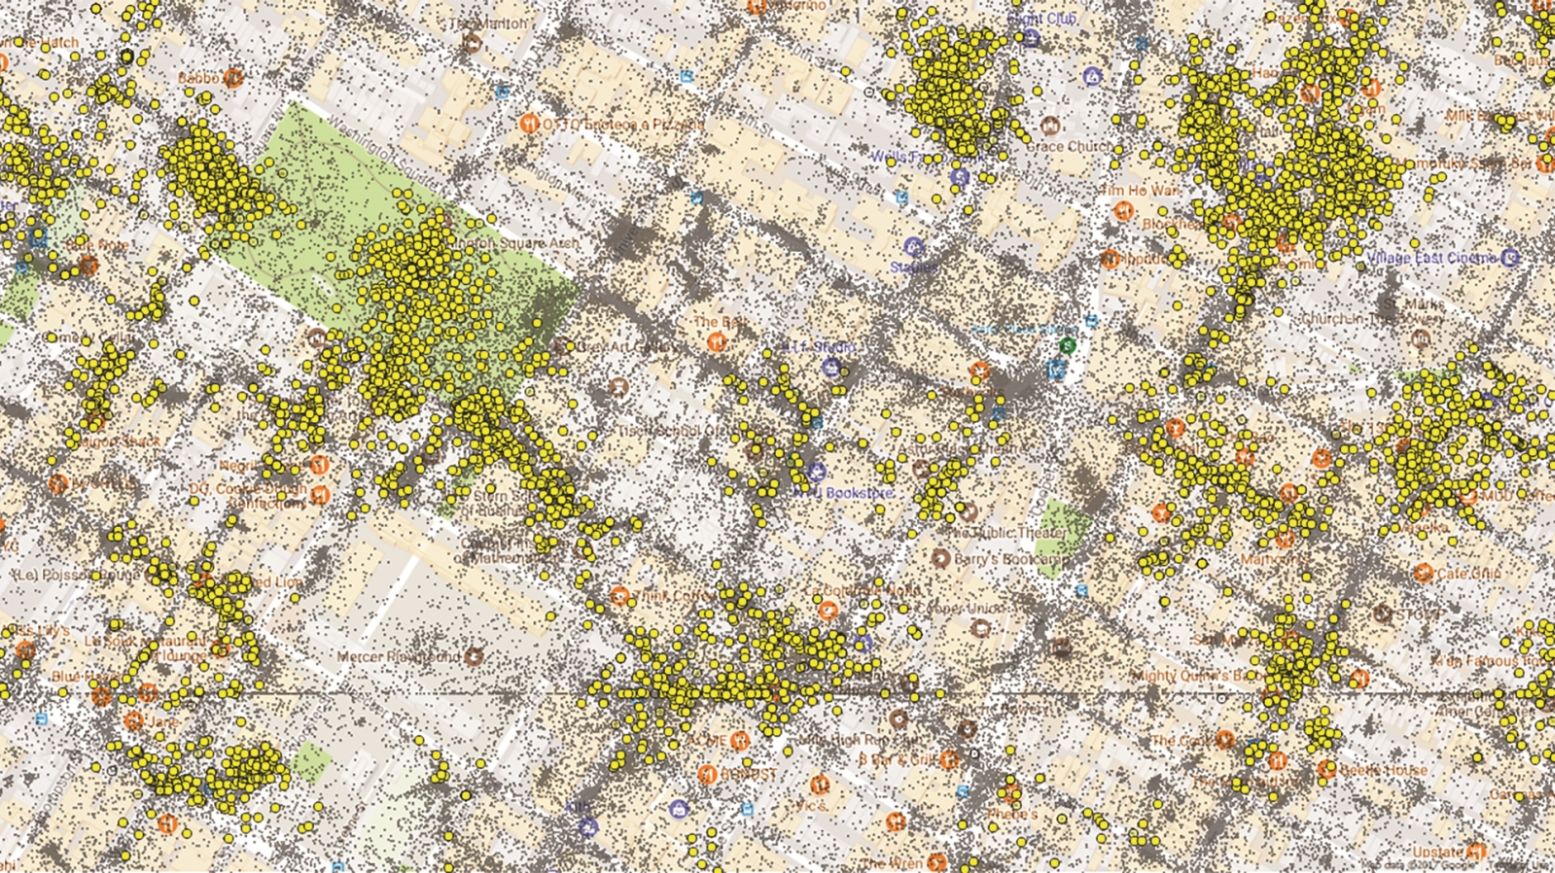
An Israeli data scientist’s new tool to chart “emotion maps” has revealed how the average person feels at specific New York City locations: angry in public-transportation stations; angry and sad in high school; anxious at Madame Tussauds Wax Museum, sorrowful near the flagship Apple Store; and surprised and happy at rock concerts, sports events, parks and restaurants.
Identifying statistically significant prevailing feelings at different locations was based on an algorithmic analysis of millions of geotagged social-media posts sent from those places in real time.
The reason for the correlation between location and emotional state — and the many ways that correlation could be applied and manipulated– remains to be explored.
For example, tourists might use emotion maps to choose spots that elicit happy or romantic emotions, or urban planners could identify and adapt areas that cause negative feelings.

“Our research was focused on technique, on the ability to build the emotion maps,” says doctoral student Ben Galon, who carried out the survey under the supervision of Yaron Kanz of AT&T Research Laboratories and Prof. Yerach Doytsher of the Technion-Israel Institute of Technology Faculty of Civil and Environmental Engineering.
“We come from the fields of computer science and geo-information, not sociology, so we have no way to explain our findings,” Galon tells ISRAEL21c. “We just wanted to show the reality and now other researchers could use this information in their field.”
Galon and colleagues made use of existing state-of-the-art methodology for understanding emotions from text, and developed an algorithm to pinpoint the prevailing emotion expressed amid that vast volume of social-media “noise.”
This wasn’t easy, Galon relates. Social-media posts are typically short and sloppily written with many abbreviations and slang that challenge accurate emotion characterization. Because a broad spectrum of emotions was expressed in each place, they had to filter out weak and random correlations. And their algorithm had to obtain significant results quickly from an immense amount of data.

Flaws in the system
Galon hasn’t found anything in the literature similar to this new technique for measuring the effect of a place on emotions. Previous studies have used questionnaires or data from body sensors — both highly flawed methods.
“When you use questionnaires, it’s a small sample of the population and results might be biased because people don’t always remember feelings accurately. Ours measures in real time and uses much more data, without which it would not work,” says Galon.
The sensor method also relies on a small population and can skew results because the participants know their emotions are being monitored.
However, Galon readily admits this new high-tech method isn’t glitch-free either.
“Results could be biased because some populations, such as the elderly or the very young, don’t post on social media and we’ll miss those users. But these biases could be fixed by understanding the gender and age of users,” Galon says.
Another possible source of bias is that people tend to tweet and post messages when they’re feeling good. “Data from social networks shows happiness is the most expected emotion because most of the data we post and want to expose to our friends is happiness and good feelings,” says Galon.

And although the method the researchers chose does understand emoticons, its understanding of sarcasm is limited. Furthermore, certain words can throw off the analysis.
“For example, we found much anger around the Museum of Arts and Design and then we found that the initials of the museum are ‘MAD’ and the emotion-analysis process is relating posts containing the MAD initials to anger,” says Galon.
Nevertheless, emotion maps based on social-media posts could enable those who run schools, museums, transportation hubs, sporting events and concerts to gauge the prevailing feeling among the people present and implement changes to see how they might affect emotions in real time.
“We’re only starting to see where it can lead us,” says Galon.


